
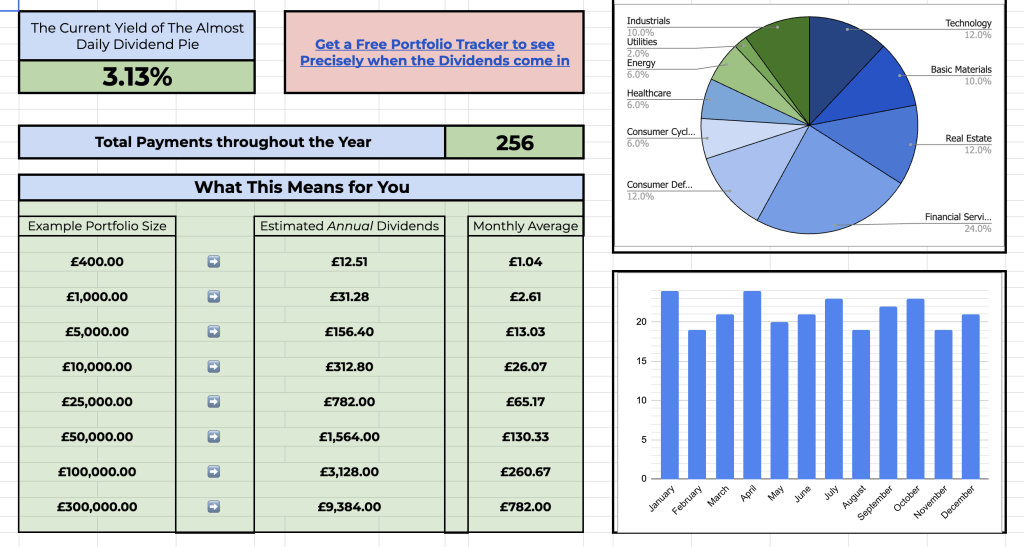
This guide explains dividend yield in simple terms, then shows you how to calculate dividend payouts and turn that yield into real-world income estimates for the Almost Daily Dividend Pie on Trading 212.
If you’re asking:
“If I invest this much, how can I calculate dividend payouts?”
or
“How much do I need to invest to earn X amount per day or per month?”
Then you’re in the right place!
Key Takeaways
- Dividend yield = annual dividend ÷ current share price
- Yields change as prices and payouts change
- Portfolio yield = sum of (holding weight × holding yield)
- If the Pie’s yield is ~3.2%:
- £1,000 invested ≈ £32/year
- Target £50/month (~£600/year) → ~ £18,750 invested
What is Dividend Yield?
Dividend yield is the percentage of a company’s current share price that is returned to shareholders in cash dividends over one year. Yields are typically quoted as an annual percentage and on a “gross” basis (before your personal taxes).
Example (GBP): If a share trades at £100 and pays £1.25 each quarter (£5 per year), the dividend yield is £5 ÷ £100 = 0.05, or 5%. Whether the company pays monthly, quarterly, or twice yearly, the yield expresses the total annual cash you’d receive per share relative to today’s price.
UK-specific notes: Many London Stock Exchange prices are shown in pence (GBX) rather than pounds (GBP). This can obviously be quite confusing for new investors. A price shown as 250p equals £2.50; therefore a 10p annual dividend on 250p is 10 ÷ 250 = 0.04 = 4%.
Also, data providers may show “trailing” yield (last 12 months of payments) or “forward” yield (the next 12 months based on declared/expected dividends). Forward yield is often more useful when planning income.
Why Dividend Yield Changes
Share prices move daily, so the yield moves too. Two investors can buy the same company at different prices and lock in different yields.
Companies can also raise or cut dividends (and FX matters for UK investors holding overseas stocks or ETFs that pay in USD/EUR).
For example, if a payout rises from £5 to £6 per year and the share price remains £100, the yield becomes 6%. If optimism pushes the price to £120, the yield slips back to 5%.
This is why I created The Dividend Dashboard spreadsheet so you can see the live, calculated yield at any time.
If I wrote a percentage figure, it could easily be outdated by the time you come to read it, so it was necessary to be able to display a live one. You can follow the instructions on how to use the spreadsheet by following that link.
How Yield Works Across a Whole Portfolio (or “Pie”)
To calculate portfolio dividend yield, take a weighted average of the yields of the individual holdings.
Step by step:
- Find each holding’s latest dividend yield (forward yield is best if you’re planning income).
- Convert percentages into decimals (for example, 6% becomes 0.06).
- Convert your portfolio weights into decimals that sum to 1 (for example, 25% per holding becomes 0.25 each).
- Multiply each holding’s weight by its yield.
- Add up those products. The result is your portfolio’s total yield.
Worked example (equal‑weight)
- Holdings & yields: 25% at 2%, 25% at 8%, 25% at 4%, 25% at 6%
- Weighted contributions:
- 25% × 2% = 0.50%
- 25% × 8% = 2.00%
- 25% × 4% = 1.00%
- 25% × 6% = 1.50%
- Total portfolio yield = 0.50% + 2.00% + 1.00% + 1.50% = 5.00%
Worked example (unequal weights)
- Holdings & yields: 40% at 2%, 30% at 6%, 20% at 4%, 10% at 8%
- Weighted contributions:
- 40% × 2% = 0.80%
- 30% × 6% = 1.80%
- 20% × 4% = 0.80%
- 10% × 8% = 0.80%
- Total portfolio yield = 0.80% + 1.80% + 0.80% + 0.80% = 4.20%
Note: If a share’s price is quoted in GBX (pence), the weighted‑average method is unaffected by whether prices are in pence or pounds; just keep yields and weights consistent.
If any holdings pay in USD/EUR, your cash income in pounds will vary with the exchange rate, so your realised (in‑GBP) yield can differ slightly from the headline figure.
Prefer a shortcut to doing all the calculating? As mentioned previously, The Dividend Dashboard pulls the live yields, then performs the weighting for you and surfaces the final, up‑to‑date portfolio yield automatically, so you don’t need to do it yourself.
How much will I earn if I invest X amount?
To estimate your dividend income, multiply your total invested amount by the portfolio’s current dividend yield.
Plain‑English formula: Annual dividend income = Investment amount × Portfolio yield
Step-by-Step to Calculate Dividend Payouts
First, let’s take the (Almost) Daily Dividend pie’s yield at the time of writing this, roughly 3.2%, as an example yield.
- Confirm the portfolio’s annual dividend yield (ideally the forward yield).
- Convert the yield into a decimal (3.2% → 0.032).
- Multiply by your investment to get your gross annual income (before tax).
- For a rough cash‑flow guide, divide by 12 for a monthly average, by 52 for weekly, or by 365 for daily.
Worked examples at a 3.2% portfolio yield:
- £1,000 × 0.032 = £32 per year (≈ £2.67/month; ≈ £0.62/week; ≈ 9p/day)
- £5,000 × 0.032 = £160 per year (≈ £13.33/month; ≈ £3.08/week; ≈ 44p/day)
- £10,000 × 0.032 = £320 per year (≈ £26.67/month; ≈ £6.15/week; ≈ 88p/day)
Dividends within aren’t paid on a perfectly regular schedule; some companies pay monthly, others quarterly or twice yearly. This means that your cash flow will naturally vary across the year.
The figures above are gross estimates. Your actual take-home will depend on your tax position.
For investors in the UK, this depends on the Dividend Allowance and whether holdings sit in an ISA or SIPP.
You can find more details in the UK dividend tax rules. Outside tax-sheltered accounts, your net income may be lower.
Because yields move with share prices and as companies update their payouts, it’s wise to revisit these calculations periodically if you’re targeting a specific income.
It’s also important to remember that the (Almost) Daily Dividends pie pays only almost daily, so the actual dividends you receive will not be the daily calculation. Different companies within the pie pay different amounts too, so the payments will be irregular in value.
I want X per month. How much do I need to invest?
To work this out, first convert your monthly target into an annual figure by multiplying by 12, then divide that number by the portfolio’s dividend yield expressed as a decimal.
For example, a target of £50 per month is £600 per year.
With a 3.2% yield (0.032), the required investment is £600 ÷ 0.032 ≈ £18,750.
If your portfolio yield were different, the required amount would change accordingly — for instance, at 4.0% you’d need £600 ÷ 0.04 = £15,000, while at 2.5% you’d need £600 ÷ 0.025 = £24,000.
Always use the most up‑to‑date yield and consider rounding up to build a buffer for price and payout changes.
Set realistic expectations. The trailing yield reflects the last 12 months of payments, while forward yield looks ahead to the next 12 months and is usually the better guide when you’re planning income.
Also worth considering is that the pounds you actually receive can be lower than the headline figure once UK tax rules and any foreign withholding taxes are applied (unless you hold inside an ISA or SIPP).
Remember that yield isn’t everything: unusually high yields can signal elevated risk or an unsustainable payout, so put quality and dividend growth on equal footing.
Reinvesting dividends can accelerate compounding over time, and broad diversification across sectors, regions, and currencies can help smooth and stabilise your income.
FAQ
Is a 3–4% dividend yield good?
It can be reasonable for diversified portfolios, but “good” depends on payout safety, dividend growth potential, and overall risk.
Why is my monthly dividend uneven?
Companies pay on different months or quarters, so income naturally fluctuates across the year.
Does share price movement change the cash I receive?
No. Your cash dividend per share is what the company declares. Price moves mainly affect the yield and how many shares you can buy when reinvesting.
Should I chase the highest yield?
Not blindly. Focus on quality, balance sheet strength, payout ratio, and consistency of dividend growth.
How do I keep the yield figure current?
If you are not using The Dividend Dashboard, then check your broker app, portfolio tracker, or the issuer’s latest announcements. Prices and dividends change, so your yield does too.