
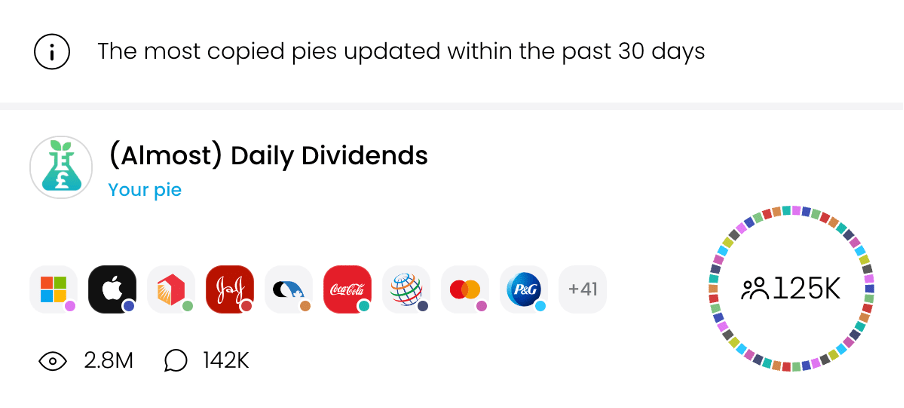
Hi, you have probably just come across The (Almost) Daily Dividends pie on Trading 212.
Now you might like the sound of it, and it’s very popular as you have probably seen!
But before you jump in, I highly recommend you watch this video to have a better idea of what it is, how it all works, and how to maintain your copy in the future. If you prefer to read it or need to run it through a translator then I will lay out the transcript below the video too:
Watch the video for the full overview of how I made this portfolio and what it’s designed for!
But before we get started… if this is the first time you are coming across this pie then the chances are you are new to Trading 212, and in that case you don’t want to miss out on the sign-up offer for new users if you haven’t got it already.

**If you are new to Trading212 and looking for a promo code to get free shares please check here! You can still get a free share if your account is under 10 days old – Don’t miss out!**
Trading 212 Promo Code for The Dividend Experiment
Now that’s out of the way – let’s get started.
Table of Contents
Introduction
What is the (Almost) Daily Dividends Pie?
The (Almost) Daily Dividends Pie is a unique investment portfolio model specifically made on the Trading 212 platform to provide investors with a steady stream of dividend payments that arrive on an (almost) daily basis.
Instead of the more common monthly, quarterly, or annual dividend schedules, this pie leverages a carefully selected mix of US listed dividend-paying stocks that, when combined, create a portfolio where payouts occur frequently.
The goal is to give investors consistent passive income, with dividends trickling in almost every day. A lot of investors in the pie have said how much of a dopamine boost it is to get those payment notifications coming in so frequently.
This pie’s strategy doesn’t rely on any single company’s stock or ETF but instead diversifies across multiple sectors, industries, and geographical markets. It includes assets with staggered payout schedules, meaning dividends are scheduled throughout each month.
By bringing together a range of different companies with different dividend payment dates, the Almost Daily Dividends Pie is built to provide a nearly uninterrupted stream of income without needing to time the market or trade actively.
Investment Philosophy Behind the Pie
The Almost Daily Dividends Pie focuses on building wealth through regular income generation.
Dividend investing is popular among those seeking financial independence or wanting to diversify their income sources, as it provides passive income without the need to sell the stocks you own.

Here’s a closer look at the key features of a pie like this:
- Long-Term Wealth Creation and Stability: Dividend-paying companies are typically mature, financially stable, and have reliable cash flows, making them less volatile than growth stocks. This can make the Almost Daily Dividends Pie an attractive choice for investors prioritizing capital preservation and income stability over aggressive growth. The emphasis on dividend-paying stocks also aligns with a conservative approach, offering a kind of “buffer” against market downturns.
- Passive Income Potential: One of the most appealing aspects of dividend investing is the ability to generate passive income—money that works for you without requiring active involvement. The Almost Daily Dividends Pie represents this concept, as investors receive regular income from their holdings, providing a consistent financial cushion or supplement to other income sources. It’s a hands-off strategy where the dividends flow into the account, either reinvested for compounding or withdrawn for use.
- Flexibility for Diverse Financial Goals: Daily dividend income appeals to a range of investor types and financial goals. For retirees or those seeking supplemental income, the pie provides a steady stream without needing to withdraw principal. For younger investors or those focused on growth, the pie offers the advantage of the potential for reinvested dividends, compounding returns, and steadily increasing share count over time. Additionally, the Almost Daily Dividends Pie works well in various market conditions, offering more stability in bear markets and reliable, though not extreme, growth in bull markets.
- Diversification Across Sectors: The pie’s design ensures diversification, reducing risk by spreading investments across multiple sectors. This approach limits the impact of any single sector or market downturn on the portfolio, providing a balanced, resilient investment that can weather economic fluctuations while maintaining steady income.
In summary, it is a portfolio that incorporates a diversity of different sectors, it doesn’t have high growth in bull markets but will have softer impact in the down markets. In other words its relatively less volatile than the market.
Then of course, it has very frequent payments of cash paid out to you.
How I Made the Pie
Once I had mapped out the payment dates, it was time to select the components for my Almost Daily Dividends Pie. I wanted a “set-and-forget” portfolio that wouldn’t require constant monitoring of individual stocks or stressing over quarterly earnings calls. So, I prioritized companies with a solid history of reliable dividends and stable financials. I didn’t want any shaky companies that might suddenly cut their dividends, forcing me to overhaul the portfolio.
Criteria 1
I focused on stocks that are safe, dependable, and unlikely to cut dividends. Of course, no one can predict everything, but I’m about 90-95% confident in the stability of the selected companies for the year ahead and continue to assess in case nay need replacing.
Criteria 2
The companies also needed to be available on Trading 212. Fortunately, I found that most of the reliable, dividend-paying stocks I’d researched were available on the platform.
To build the pie, I started by choosing as many stable monthly payers as possible since they offer 12 payments a year. Then, I added solid quarterly payers, most of which are from the U.S. because the U.S. market has more frequent payout schedules than the UK market, which typically pays semi-annually or annually.
This meant a very U.S.-heavy portfolio to the point where it is now 100% US-listed stocks, but it offered the stability and frequency I wanted.
Finally, I added a few of my favourite stocks that might not be official “dividend aristocrats” but have a good track record and strong financial positions, either because of their industry or individual performance.
The result?
A portfolio designed to provide about 260 dividend payments spread out throughout the year, making it truly an “almost daily” dividend portfolio.
It is often interesting to hear clueless commentators on the pie saying that it is just a random bunch of stocks assembled together to pay out dividends almost daily – but, clearly, that is not the case…
If I had truly just picked random companies and not prioritised dividend safety then I highly doubt the pie would have survived to this date, at the time of making the video – 4 years after it was created.
How Pies Work (Generally)
Just in case this is the first pie you have ever used, created, or copied I just want to explain how pies work in general.
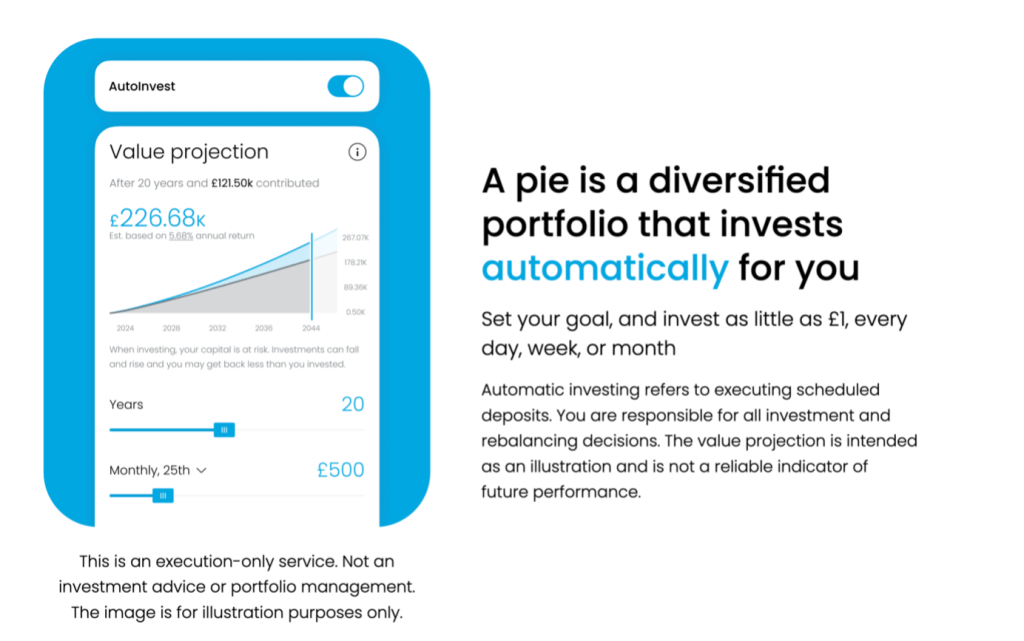
Trading 212 Pies are a unique portfolio feature that allows you to build, customize, and automate a collection of stocks or ETFs in one simple “pie” structure. This feature is ideal for creating a diversified portfolio with set allocations to each component, making it easy to manage and track investments in a single view. With Trading 212’s pies, you can add, remove, or adjust the weight of any stock or ETF to meet your desired allocation.
Once you’ve set up your pie, Trading 212 offers a Reinvestment option that automatically reinvests any dividends received. This feature enhances compounding by using dividends to buy more shares, which in turn generates more dividends over time.
Additionally, the Auto-Invest feature allows you to automate regular contributions, so you can schedule deposits into your pie recurrently, maintaining consistent growth without manually managing it.
If you are copying a pie made by someone else, in this case – me. You are copying a template. It’s not a live copy that updates and changes as soon as I make any buys or sells.
It’s like you get some instructions of how to organise a series of 50 stocks and then you invest money into that.
If I make an update you can choose to update yours too, but we will come to that later on in the video…
Disclaimer:
Pies & Autoinvest is an execution-only service. Not investment advice or portfolio management. Automatic investing refers to executing scheduled deposits. You are responsible for all investment and rebalancing decisions.
Recommended Requirements to Start Copying
People often ask what are the minimum recommended requirements needed to get started in the (Almost) Daily Dividends pie.
The actual minimum requirement to invest in this pie is £50 (or whatever your currency is), this is because of the way it works where the pie creator can decide a minimum amount by choosing the slice size.
For example, if I had made the smallest slice 1% you would need £100 to invest in it.
If I made the smallest slice 2% (which it is as there are 50 stocks in this pie) then you would need £50 to invest in it
If I made the smallest slice 20% Then it is only £5
… and I am sure you get the picture by now.
So technically the minimum is £50 however the minimum that I recommend, or in other words the recommended minimum investment is £400.
This is the lowest round number amount that you need in order to get dividends from all of the stocks in the pie.
If you invest less than this then you might get dividends less than 1p in which case would be rounded down – meaning you lose out.
So… why did I make the actual minimum £50 rather than £400 if that’s the case?
This is so you can reinvest your dividends hopefully quicker or make smaller additional adjustments to the pie.
Another consideration here has to do with ISA investors from the UK and the foreign exchange fee rounding up. Outside of the ISA, it makes sense to convert money to USD before buying into the pie if possible whilst that is not possible inside the ISA.
Investing smaller amounts at a time means that the FX fee will be relatively larger if it rounds up.
How to Get Updates if the Pie Changes
If your pie is linked and you have notifications on, then when I make a change to the pie you should get a notification telling you that you will need to update in order to keep to the current template of the pie.
That being said, there are a few problems with this system.
First, if you edit or customise the pie yourself you become “unlinked” or “delinked” or whatever the terminology is and might not receive notifications.
Secondly, the notification doesn’t give any indication of why I made the change, it just asks you to accept the change or not and there is no reasoning for the change whatsoever.
To counter these two problems I set up an email list that I send out the email that gives a thorough explanation of what I changed and why I changed it and that will give you some background information so you can make your own decision.
That means if you want to make some edits to the pie but still want to know what’s going on with the original then join the email list.
It’s also there for people who don’t tend to check their notifications often enough but will pay attention if there is an email coming in.
It is quite sad to see comments like:
“when are you replacing this certain stock? It’s been underperforming recently”
Where I had made an update many months prior that removed that stock, to the point I didn’t even have a reason to keep track of it anymore.
So in summary – if you feel fine with copying the template and then dealing with it after that then you can rely on the notification.
However, if you are serious about keeping it up to date then it’s worth joining the email for the full reasoning behind the change.
How Long Does it Take to Get Dividends?
Here is pretty much the defining question which will allow everyone to know whether someone asking on the pie feed has watched this video or not.
One of the most frustrating things about creating this pie are the people who copy without putting in any level of research themselves. It usually goes something like this where someone angrily comments:
“This pie is a scam, I have been invested for a week and a half and I haven’t had any dividends!”
A comment like this makes it very clear that this person doesn’t understand how dividends work.
So, I will explain here:
Dividends are paid out by companies to reward their shareholders, but to receive a dividend, you must own the stock by a specific date, known as the ex-dividend date. Here’s how it works, there are 4 relevant dates:
- Declaration Date: The company announces the dividend and sets key dates, including the ex-dividend date.
- Ex-Dividend Date: This is the crucial date. To be eligible for the dividend, you need to own the stock by the day before this date. If you buy on or after the ex-dividend date, you’ll miss that particular payment.
- Record Date: This is when the company records the shareholders eligible to receive the dividend.
- Payment Date: This is when the dividend is actually paid out to shareholders.
If you invest in a dividend portfolio (like this pie) today, you’ll need to wait until future ex-dividend dates for each holding to qualify for dividends.
Dividends aren’t paid out immediately after purchase because they follow this scheduled cycle.
As each stock in the pie reaches its ex-dividend date in the coming weeks or months, you’ll gradually start receiving dividends from different holdings, eventually leading to more frequent payments as the cycle continues.
In short, while dividends don’t start immediately after investing, with time and reinvestment, you’ll build a steady stream of income as each component in your pie hits its payout schedule.
So, it’s not really a question of “How long until I get dividends?” and there being a simple timeline answer, as it completely varies on when you started and which dividends you are entitled to since.
If it gets to one full month in and you have not received a single dividend yet, then that would be surprising. By the end of the 2nd month, you should be in the full “flow” of dividends rolling in almost daily.
So, if you invested 4 days ago and haven’t had a dividend yet, please don’t start telling everyone that the pie is a scam… it’s kind of like broadcasting you don’t know what’s really going on.
So many people were confused by this concept that I ended up making a lengthy guide to Dividend Investing. If you are new to Dividend Investing (not just this specific pie) it’s well worth a watch:
How to View Dividend Yield
Another very common question that people ask about the pie is – What is the current yield of the pie?
People often get confused between the yield and the “AAR” that it displays on the pie screen on Trading 212. For that reason, I will just quickly explain the difference and then show you how to check the yield live at any time.
Dividend Yield is like the “income” percentage you earn from a stock each year, based on its price. Think of it as how much cash you get back just from holding the stock.
So, if you invest £100 into a stock with a 5% yield then you are getting £5 back, that’s the simple view on dividend yield.
The thing is income from dividends is only one part of the story of investing in stocks, the price of the stock goes up and down too – and that’s where the AAR figure that is shown on the Trading 212 screen comes in.
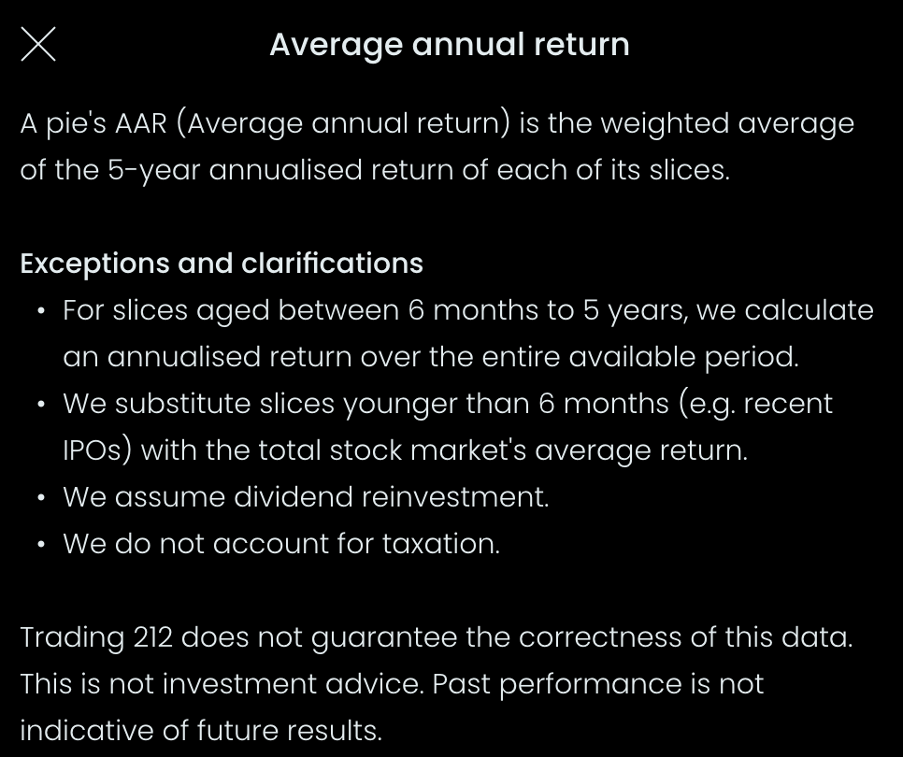
AAR (Average Annual Return) shows the overall yearly growth of your investment, including both dividends and any increase in stock price. It’s the big-picture measure of how well the investment grows each year on average.
The one shown on Trading 212 is actually the average over the past 5 years.
In short,
Dividend Yield = Income only,
While AAR = Income + Growth.
That means don’t interpret the yield as all you get from your investment, the share price changes impact your return too.
It also means don’t interpret the AAR as how much you will get paid in dividends.
I have found copiers getting these two percentages mixed up is very common so it isworth adding this section in here.
Now, you can find the yield on The Dividend Dashboard spreadsheet in the Portfolio Details tab, then at the top just under the Total Portfolio Annual Yield you can see it. As the data is pulled from Yahoo Finance live the yield is also updated live.
Check out The Dividend Dashboard here
How Much do you Get in Dividends for X Amount?
While we are on the topic of The Dividend Dashboard, why not answer another one of the most commonly asked questions of all time.
“If I invest <this much> into the pie, how much will I get in dividends?”
I was getting so many iterations of this same question, and I gave up trying to explain how to answer this question 5/6 times a week so I made a whole spreadsheet so anyone who copies the pie can see just how much they can expect in dividends.
All you need to do is go to The Dividend Dashboard on Google Sheets and type in however much you want in Cell B4 to find out!
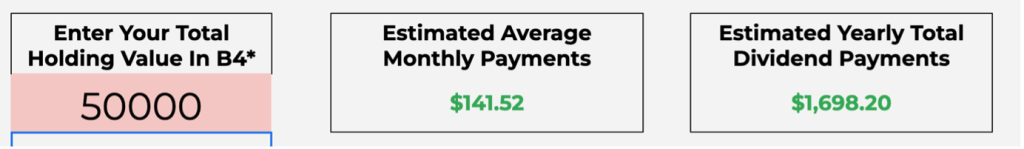
So here you can see if you have $50,000 invested in the pie then you can expect an average of $141.52 a month in dividend payments spread across the month or $1,698.2 in annual payments spread across the year.
Now if you have the minimum of 400 mentioned earlier this is what you can expect, about 1 dollar and 13 cents a month or the equivalent of $13.59 a year.
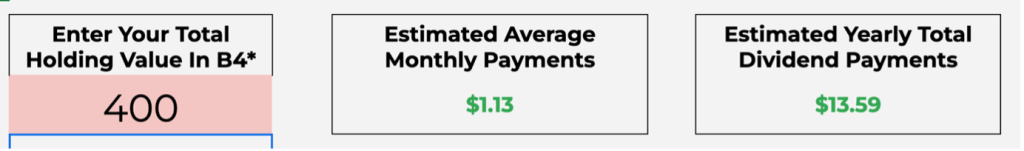
Now I do want to re-emphasise that this is correct at the time of making the video but as the price of stocks change slightly every day or some stocks are replaced with others over time then it’s best to refer to the spreadsheet to see what the figures are right now.
It’s important to read this as you can only edit cell B4 i.e. enter your portfolio value on the live sheet and you can’t make a copy or it won’t work (so don’t ask!)
Rebalancing – What is it? How Often and Why?
The process of realigning the weightings of a portfolio of assets is known as rebalancing.
Rebalancing is purchasing and selling assets in a portfolio regularly in order to preserve an original or intended level of asset allocation or risk.
For example, the typical, (slightly dated nowadays) conservative portfolio would be something like 60% stocks and 40% bonds.
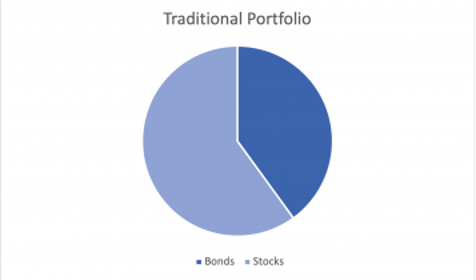
This is conservative because stocks tend to be riskier so the person building this portfolio is likely to not want to take too much risk and so has a high proportion of bonds in that portfolio too.
Over time the stocks are likely to grow at a faster rate than the bonds if it is a bull market for stocks. This means that the portfolio will go from 60% stocks and 40% bonds to closer to 75% stocks and 25% bonds.
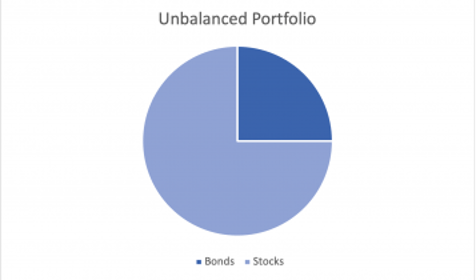
Now the investor wanted 40% bonds, not 25% because they were concerned about the risk.
So, although they didn’t actually do anything, their portfolio is now too risky for their own requirements.
Therefore, they need to balance the stocks and bonds back to their original allocation.
This involves selling the stocks that are higher than before and then buying the bonds.
This is rebalancing.
As you can see rebalancing will inherently buy low and sell high – the mantra of every good investor.
Why You Should Rebalance
Rebalancing offers several benefits:
- Maintains risk levels by preventing the portfolio from becoming too reliant on a single asset type.
- Buy low, sell high: Rebalancing naturally involves selling appreciated assets and buying those that have underperformed, potentially improving returns over time.
- Optimize dividend yield: For portfolios with dividend stocks, rebalancing can increase yield by redistributing investments from high-price stocks (lower yield) to undervalued stocks (higher yield).
How Often Should You Do It?
Studies show minimal differences in performance between monthly, quarterly, semi-annual, and annual rebalancing.
However, portfolios that are never rebalanced tend to underperform.
A general recommendation is to rebalance annually, which provides a balance between maintaining the target allocation and minimizing trading costs due to bid-ask spreads.
I made this video already in my attempt to try to explain why I think that 6.5 score is around the time to start thinking about rebalancing so worth watching that to get a full explanation… but 6.5 is the score that I would say if you asked me to put an actual number to it.
How to Add Funds to Your Pie
After you have added your initial investment of 400 its fine to add increments of 50 (bearing in mind the FX considerations I mentioned earlier).
But the method to add the money is often asked about too, so I will quickly go over each now.
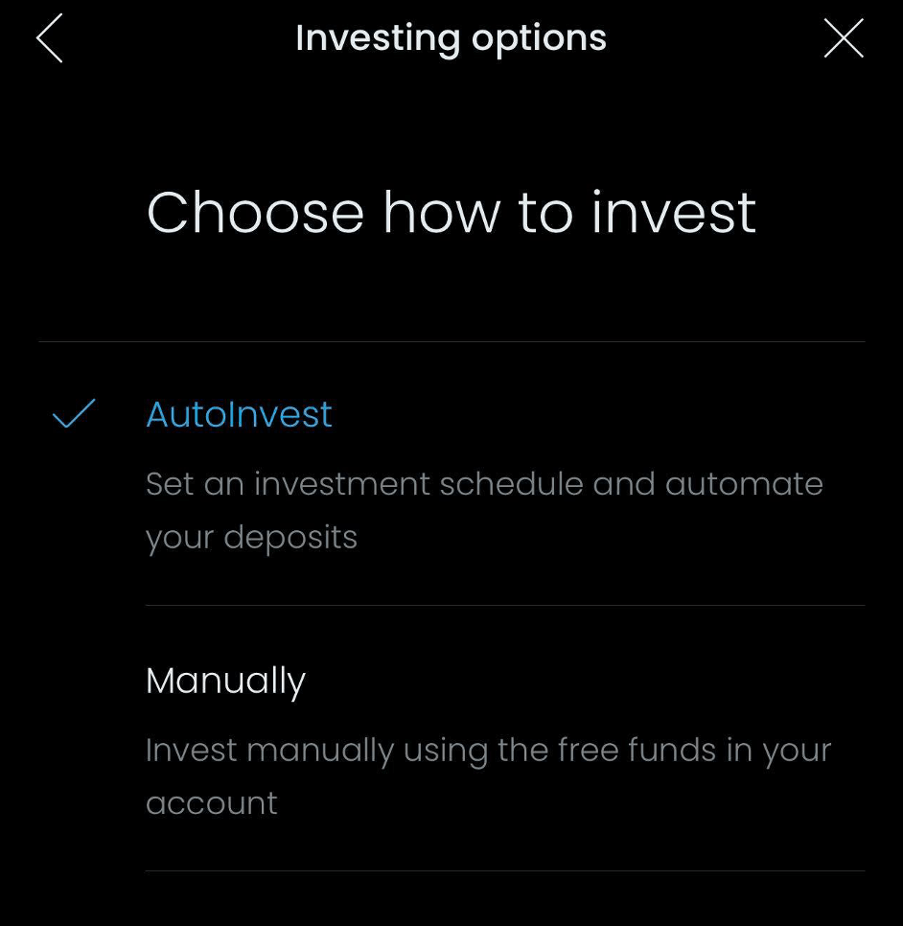
The first is Auto-invest – this is the hands-off approach where money will be automatically deposited into your account from your bank at set intervals. This means that you don’t need to worry about the market, you just add to your portfolio on a regular basis.
The other option is to invest Manually – this option is for those investors who aren’t sure if they can allocate a certain amount of their budget each month to investing or want to be more flexible about when to deposit.
What’s the difference between Auto-Invest and Manual?
There is not really a big difference between these two options other than Auto-Invest will take care of it all on your behalf, whereas manual gives you a bit more flexibility in how you want to add to your portfolio in the future.
You can also change your mind later if you don’t want to keep making deposits on Auto-Invest or if you are in a more stable financial condition and want it taken care of for you now.
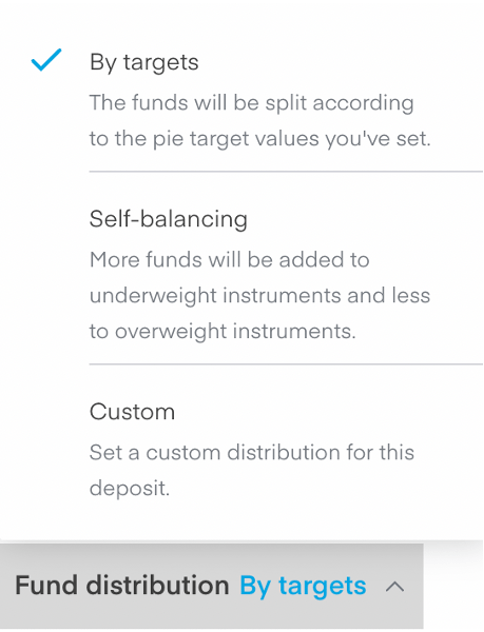
Then there are also the 3 options for additional deposits:
As always, I don’t really like general ‘Shoulds’ because people’s finances are all in different states and situations but here are my thoughts on those three options.
Custom
I would pretty much ignore this option, if you are thinking of doing it this way you are probably overcomplicated with something that should be made as simple as possible (automated investing).
If you are tempted to be custom allocation each time – why not just hold the stocks you like individually and just buy more of them when you think they look undervalued? I don’t really see a scenario where it makes sense to be custom investing each month, but happy to be proven wrong is there is something I am not seeing.
Self-balancing
If I were copying a pie, I would start off with doing self-balancing, early on while your portfolio is still being built up, the deposits you add will have a big impact on the overall allocation.
For example, if you start with 400GBP and add 100GBP a month, that first deposit you are adding is a 25% increase in your overall portfolio size just in the first month.
This means that the deposits you add will have a significant enough impact on the balancing of the portfolio you most likely won’t need to do pie rebalances outside of when you add to the pie.
At first, I would just go with the self-balancing option as I add to the pie. It just keeps it simple and is less of a manual effort for the investor.
By Targets
Once your portfolio reaches a level where the additions you are making are not significantly changing the pie total then you can switch to adding by targets and then manually rebalancing.
If we go back to the example earlier, where adding the 100 pounds was an additional 25% of the portfolio total, obviously this becomes less and less of a percentage over time.
After 3 years, following the same amounts, you might have reached a portfolio of 4000GBP.
This would be 400 GBP as a starting amount then 100 a month multiplied by 36 months and still want to contribute your regular 100 deposit.
This will now only constitute 2.5% of the overall portfolio and is borderline whether it will be enough to truly rebalance the pie – depending on how volatile your chosen investments are.
So in short – self-balancing is fine, if you do it by target allocation you will need to rebalance manually yourself and after a certain portfolio, size self-balancing won’t be enough to balance anyway.
The Pie’s Performance
This is a very justified question, really, as you want to know what you are getting into as a copier.
Now the pie has been going for a while now (over 4 years at the time of making this video) so the AAR is a pretty good representation of the long-term expected returns, on average.
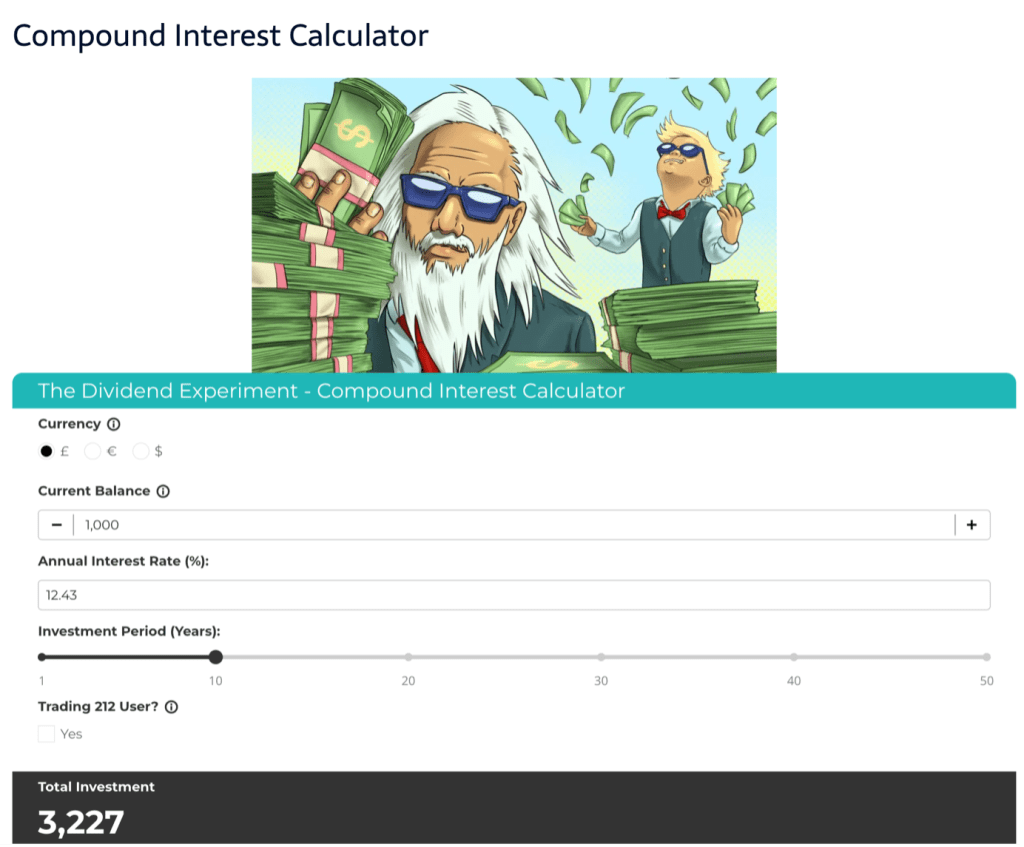
To get a better picture of what the portfolio size looks like at that level of return I made this calculator which I will link to too.
The average annual return percentage or AAR is already input into the annual interest rate but you can customize it and play around with it if you just follow the link to the website.
The Compound Interest Calculator
The way I see it, the 3 most commonly compared investment styles for someone considering making a copy of the Almost Daily Dividends pie are:
- Another similar dividend fund – in this case we will use £VHYL
- The S&P 500
- Getting Interest on Cash
So, I will just give a brief overview of each of these so that you can get a better idea of how they compare.
Comparison with VHYL
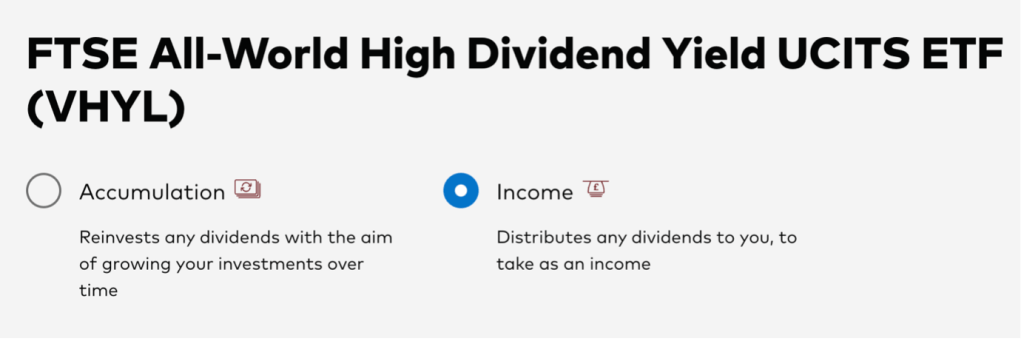
If you are not sure of what VHYL is then the ticker symbol VHYL represents the Vanguard FTSE All-World High Dividend Yield UCITS ETF. This exchange-traded fund (ETF) aims to track the performance of the FTSE All-World High Dividend Yield Index, which includes large and mid-cap stocks worldwide that are expected to have above-average dividend yields.
In my opinion, this is a good comparison for “another type of dividend investment” and I often use this as a proxy for dividend investing in general.
So how does the (Almost) Daily Dividend Pie compare to this as an investment?
The Almost Daily Dividend Pie and VHYL (Vanguard FTSE All-World High Dividend Yield UCITS ETF) serve different investment goals, though both focus on dividend income. VHYL is a globally diversified ETF that includes large and mid-cap companies with high dividend yields, making it a straightforward choice for passive, long-term investors seeking regular income and global exposure.
With a relatively low expense ratio of 0.29%, VHYL offers a cost-effective way to invest in high-dividend companies, with holdings in sectors like technology, financials, and energy. Its top holdings in stable, established companies also make VHYL relatively low-risk compared to high-yield portfolios focusing on individual stocks.
So in comparison, the (Almost) Daily Dividend pie has more frequent dividends, a lower cost to implement and over its existence it has outperformed VHYL.
Though VHYL is more diversified as it has a wider range of stocks from different countries rather than just the US-listed stocks in the (Almost) Daily Dividends pie and requires less user maintenance such as rebalancing and updating than (Almost) Daily Dividends pie.
Comparison with the S&P 500
Most people investing in the S&P 500, rightly or wrongly, are likely using VUSA or VUAG ETFs provided by Vanguard – as it’s the biggest name in the space – so we will compare with that tracking fund.
To be honest it won’t make a significant difference to the point I will be making here but it’s just so we have something for the specific references.
The difference between VUAG and VUSA is that VUSA pays you out the dividends whereas VUAG reinvests them back in for you.
Either fund has a total expense ratio (TER) of 0.07% per annum, making it a cost-effective option for investors seeking exposure to the U.S. equity market, though investing in a pie you make yourself or copy is cheaper you just have to manage it yourself.
Over the long run, the S&P is more likely to outperform the (Almost) Daily Dividends pie
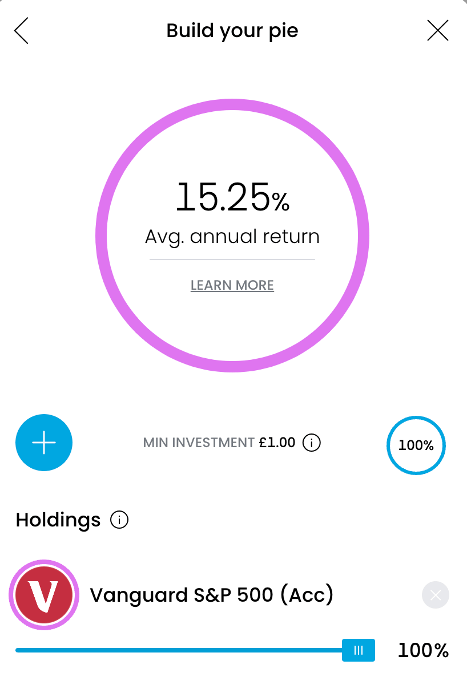
You can see that the AAR is 15.25% when measured over the last 5 years which has done better than the (Almost) Daily Dividends pie.
A few things that (Almost) Daily Dividends does better are:
- Higher yield of dividends
- Frequency of payments
- Lower volatility
- Tends to outperform in bear or down markets
The reason for the outperformance in bear markets is that it tends to fall less far downward if the market falls.
So if you are looking for stable income paid out frequently then its worth going for the almost daily dividends, but otherwise if you only care about total returns or a completely set-and-forget style then the S&P 500 is a better choice of the two.
And now finally the third comparison:
Comparison with Cash
When a lot of people hear cash they think of some coins you find down the back of the sofa but what I actually mean here is the interest you get in your bank or on uninvested cash like you can get on Trading 212.
The way people usually ask this question is something like this:
“I can get 5.?% On trading 212 just in cash, why bother with this pie if its yield is only 3.?%”
People asking this are either not sure how investing fully works or are only thinking one-dimensionally.
As we know from the earlier question: Return = Income + Growth.
Cash doesn’t grow by itself, it only pays you an income so that % you see is what you get. The good thing about that is that its predictable but there is a limited upside as the income is the ceiling of that return you are going to get.
Investing in dividend stocks, however, can give both. The shares can grow (or shrink) and you get the dividends as income too.
The downside is that the stocks can fall in price so that equation could look more like return = income – growth if you have negative growth, but that just means you have to be careful with what you buy.
Over the long run, the return of the almost daily dividends pie should almost certainly outperform the rates you can get on cash, however, you will need to be prepared for the volatility.
In all honesty, I have given up trying to seriously answer comments like:
“I have invested in this pie for 2 weeks and the interest on uninvested cash is doing better!”
These types of people probably shouldn’t be investing if they are uncomfortable with even a relatively low volatility (in the grander scheme of things) investment like this pie.
I don’t mean that in an insulting or investing-gatekeeping way, it’s just that they won’t be mentally or emotionally ready to handle the situation if there is a market crash.
And then finally…
How to Learn More about Investing?
Since the last FAQ and the (literally 1000s) of questions I have had, I’ve been working on something special—a project that’s honestly taken way too long to get just right.
For those looking to improve their investing knowledge, I’m thrilled to finally share it with you: The Dividend Academy!

The Dividend Academy is a platform for anyone who wants to grow their wealth through smart investing.
Whether you’re new to investing or looking to add some new strategies, this course is all about building wealth and having a better understanding of what exactly you are doing in the stock market.
At The Dividend Academy, the focus is on actionable knowledge. This isn’t just about theory—you’ll be equipped to make informed investing decisions.

Easy-to-Follow Lessons:
The course is structured in a way that’s easy to follow. Lessons are delivered through engaging, animated videos that break down even the most complex topics, making them simple to understand. Even if you’ve never invested before, you’ll be able to pick up new strategies quickly and confidently.
Diverse Investment Strategies:
Despite the name – dividend investing is not the only strategy covered. You’ll learn about a variety of approaches to building wealth, allowing you to tailor your investment journey to fit your own goals and lifestyle.
Constant Updates:
Markets and trends are always shifting, so the course keeps evolving, too. You’ll receive lifetime future access to every update, keeping you in the loop on the latest techniques, no matter how much the investing landscape changes.
Supportive Community
By joining The Dividend Academy You also get a premium lifetime membership to the premium tier of The Dividend Temple Discord too. That comes as an added bonus of your enrolment fee.
Investing can sometimes feel like a solo journey, but it doesn’t have to. As a member, you’ll join The Dividend Temple, a community of investors where you can ask questions, share tips, and get insights from others on the same path.
It’s a supportive, judgment-free zone to learn and grow.
One of the biggest advantages of The Dividend Academy is lifetime access. You pay once, and that’s it.
No additional costs for future updates, and no subscription fees—just a lifetime of access to every piece of content that is added over time.
You can check that all out on TheDividendAcademy.com
Conclusion
I hope that this guide has helped you decide whether or not the (Almost) Daily Dividend pie is for you.
Even if you watched all this video and got to this point and you took in all this information and now decided that the almost daily dividend pie is not for you, I would still consider that a huge success in terms of explaining the pie.
Something that people don’t seem to realise is that I don’t actually get anything when people copy the pie. It doesn’t make a difference to me at all if 1 person copies or 1 million people copy, therefore I never try to get people to invest in it and would much prefer you to find something that suits your own goals.
If that is the (Almost) Daily Dividends portfolio, then welcome aboard!
If that’s not the (Almost) Daily Dividends portfolio, then I appreciate you taking the time to read everything on this page and would love to see you as a Subscriber on the Youtube Channel and maybe see something you do find interesting on there!