
Please note: in order to access all of the features shown below you will need a premium subscription and you can often get a % discount by following the referral link here.
If you’re completely new to tracking your dividend portfolio using GetQuin, first you navigate to their website or download the app if you prefer to use your phone.
Creating your Getquin Account:
After creating your account, you can follow the prompts. The app will guide you through a series of personalisation questions that you can answer easily without help. Continue until you reach this screen:
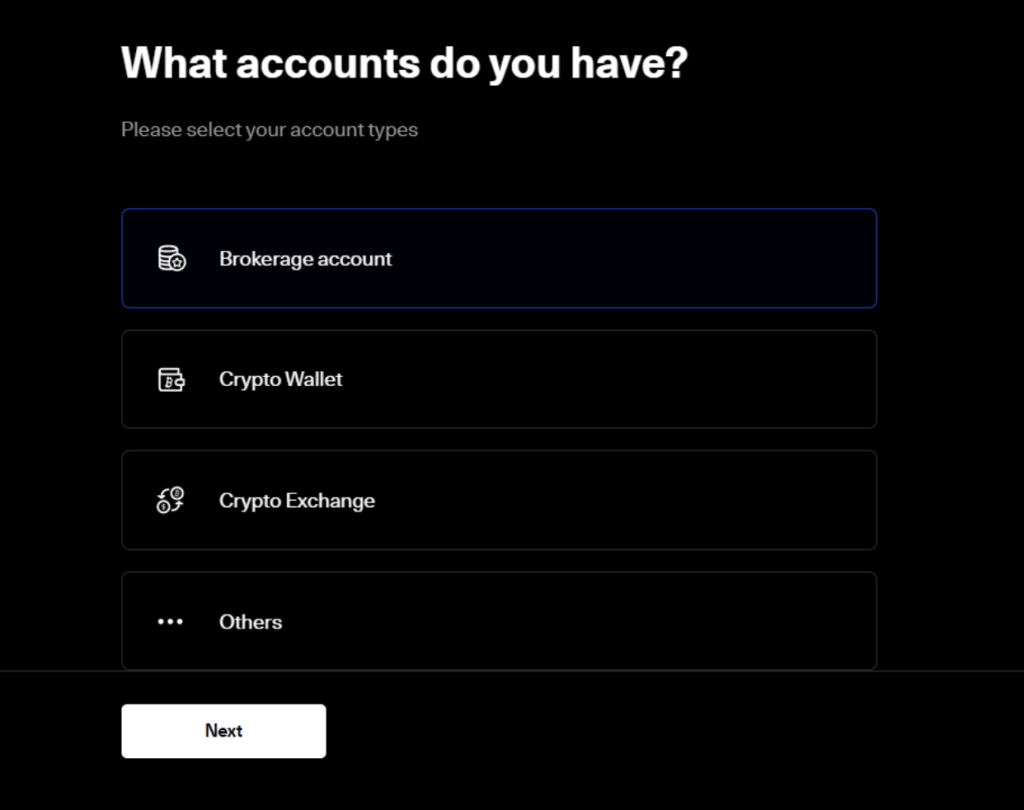
Choose the Brokerage Account, and if you’re currently using Trading 212, choose Trading 212.
On the topic of Trading 212, if you have opened your account within the last 10 days then you can use the Trading 212 promo code here to get free fractional shares worth up to £100
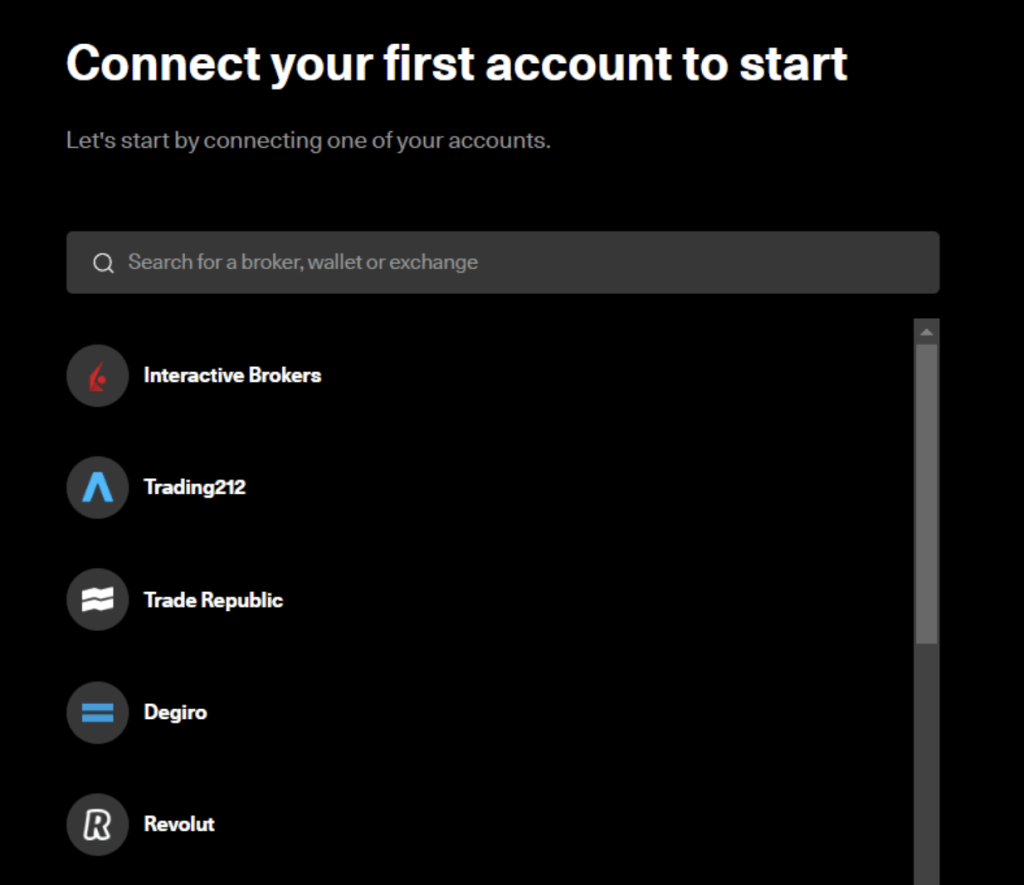
GetQuin will ask you to import your Trading 212 Portfolio using the API.
Note: Significant improvements have been made to the brokerage connection with Trading 212. Based on user feedback, the import has been completely reworked to provide reliable, accurate, and up-to-date data. Previous users who couldn’t get the API method to work are encouraged to update their application to the latest version.
Another option is to add your positions manually. This method is relatively self-explanatory, however, it is slightly more complicated to do it manually than via the API. You just have to manually input each of your holdings one by one to get them to show up on the software.
Dividend Portfolio Display on GetQuin
You can view your positions on the portfolio page.
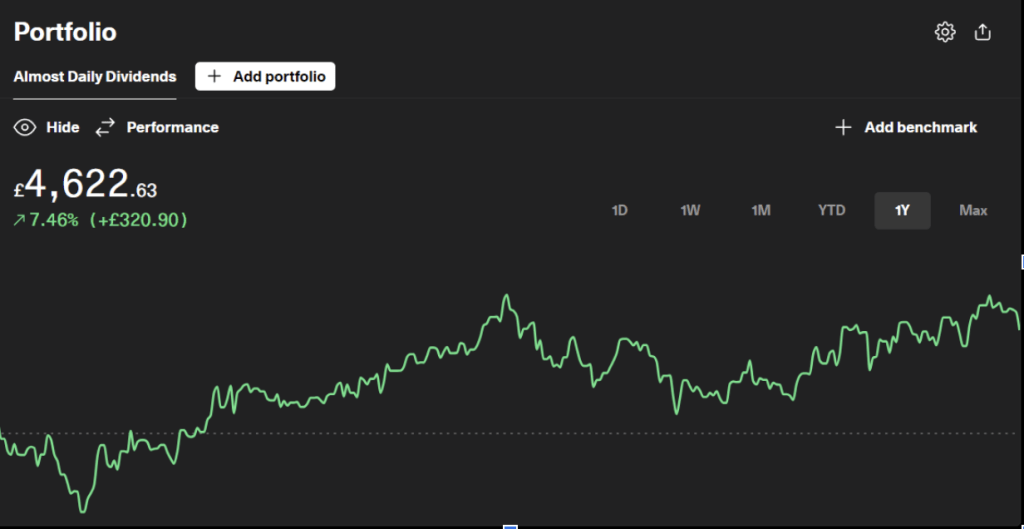
For this example, we’ll use the ‘(Almost) Daily Dividend Pie’ to demonstrate how to track dividends with GetQuin. The amounts and holdings are purely for demonstration purposes only.
Let’s go through each section to give you an overview of the user interface and how to navigate it effectively.
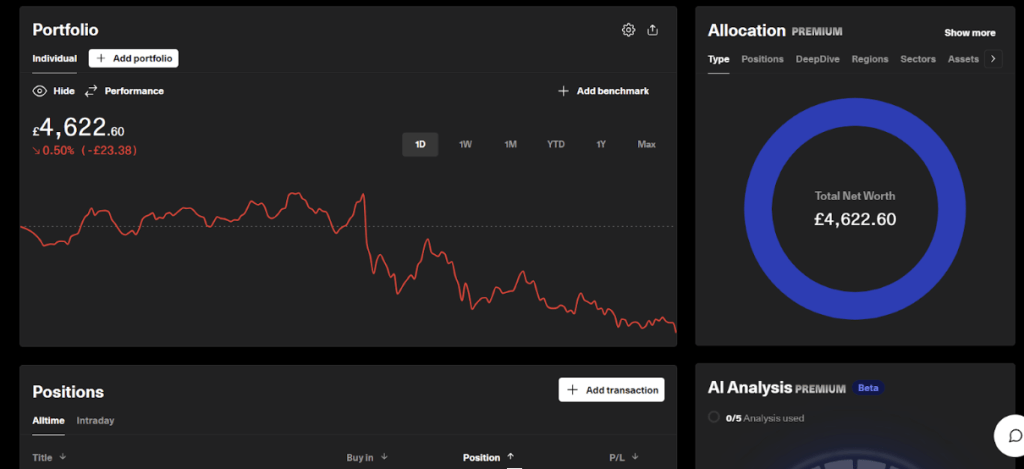
Portfolio Section
The first section is the Portfolio.
After importing your portfolio from your broker or after you manually imported your positions/portfolio, you will be able to see the performance of your portfolio based on the current value of the stocks in the portfolio.
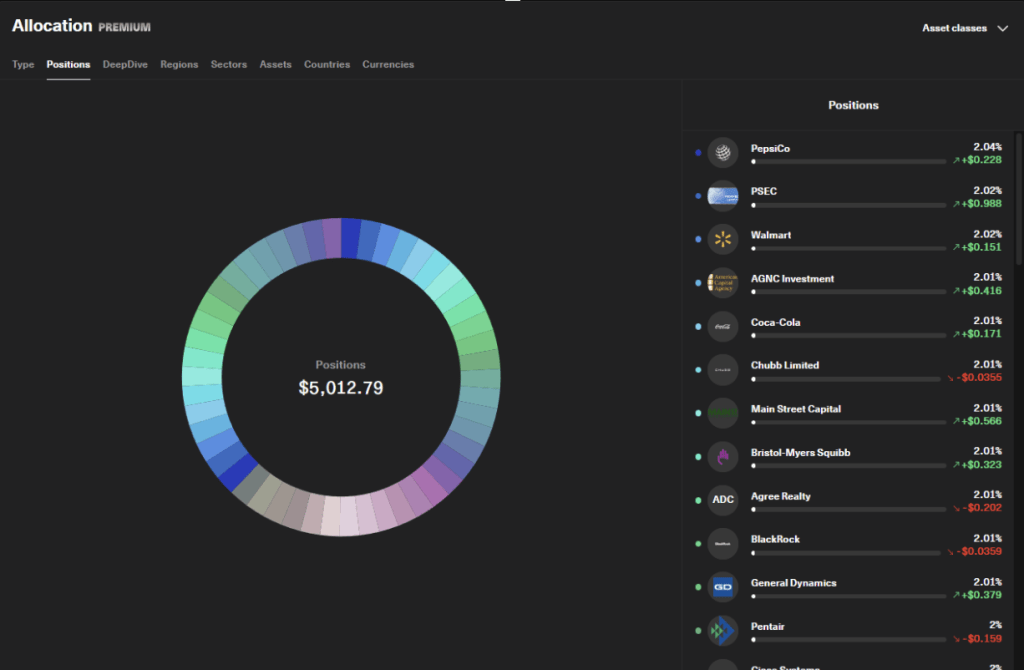
Allocation Section
Next is the allocation. In this section, you will be able to see the positions you have in your portfolio, this display is pretty much the same as the pie display from Trading 212.
In Positions, you can see stocks that you currently hold. These are the positions you imported from Trading 212.
If you chose manual adding of positions, you can also do that under the position section and “Add Transaction”
Dividends Section
Tracking your dividends will be under the Dividends Section.
Here, you can view upcoming dividends, past payments, and totals. You can also set up notifications for dividend announcements and payments to stay updated.
Use the Reports or Analytics feature to visualize your dividend income over time.
You can navigate and change the year to see all the dividend payments you got every month.
By subscribing to their premium plans, you will also unlock features like tracking payout, Year-on-Year growth and etc.
You can often filter by time periods or specific stocks to see detailed insights.
You will also be able to see a forecast of your dividends.
We’ve now covered the introduction to the Dividend Section, which is the main focus of this topic. Let’s go through each part in detail to ensure we’re all on the same page moving forward and explain what each part really means.
Dividend Tracking Breakdown
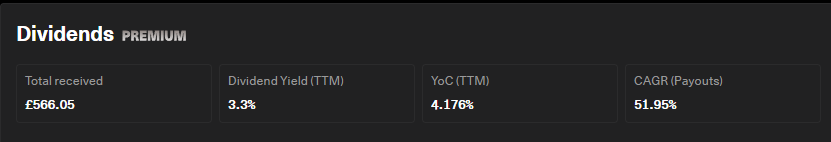
Under the Dividends Section, there will be 4 metrics above.
- Total Received
- Dividend Yield (TTM)
- Yield on Cost (YoC)
- Compound Annual Growth Rate (CAGR / Payouts)
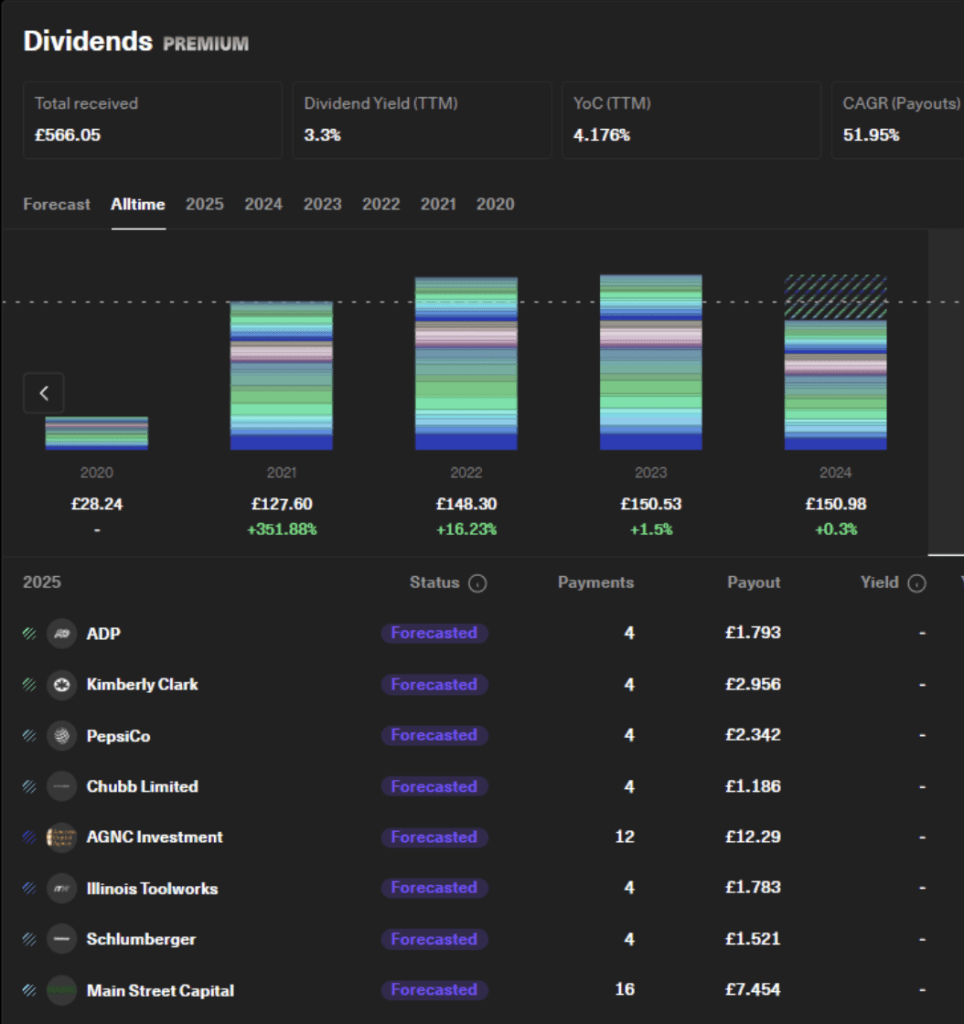
Total Received: These are all dividends received during your investment. Announced dividends are not taken into account only the ones that have actually been scheduled to arrive in your account.
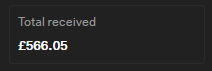
For example, let’s say you invested £5,000 4 years ago which is the year 2020, if you follow the Almost Daily Dividend by then, your total received dividends will actually be £566.05.
Dividend Yield: This is the percentage of your current portfolio value that has been paid out in dividends over the past 12 months, or in this example, the Trailing Twelve Months Performance of Almost Daily Dividends Pie.
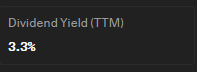
In this example, the dividend yield currently sits at 3.3%
Yield on Cost: this is your dividend yield of the last 12 months in relation to your invested capital.
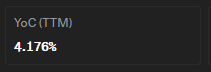
In this example, the YoC currently sits at 4.176%
Compound Annual Growth Rate: This is the annual percentage growth rate of your portfolio’s dividend payouts over your transaction history.
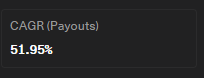
In this example, the CAGR value is at 51.97%. This means that, on average, your dividend payouts have grown by 51.97% each year over the period you’re tracking.
If you manually add each of the stocks in your portfolio, make sure that you enter the purchase date so the previous growth value will be calculated and shown.
Now that you already know what those metrics mean and what they show you, this will give you the ability to read your portfolio’s dividend performance in one look.
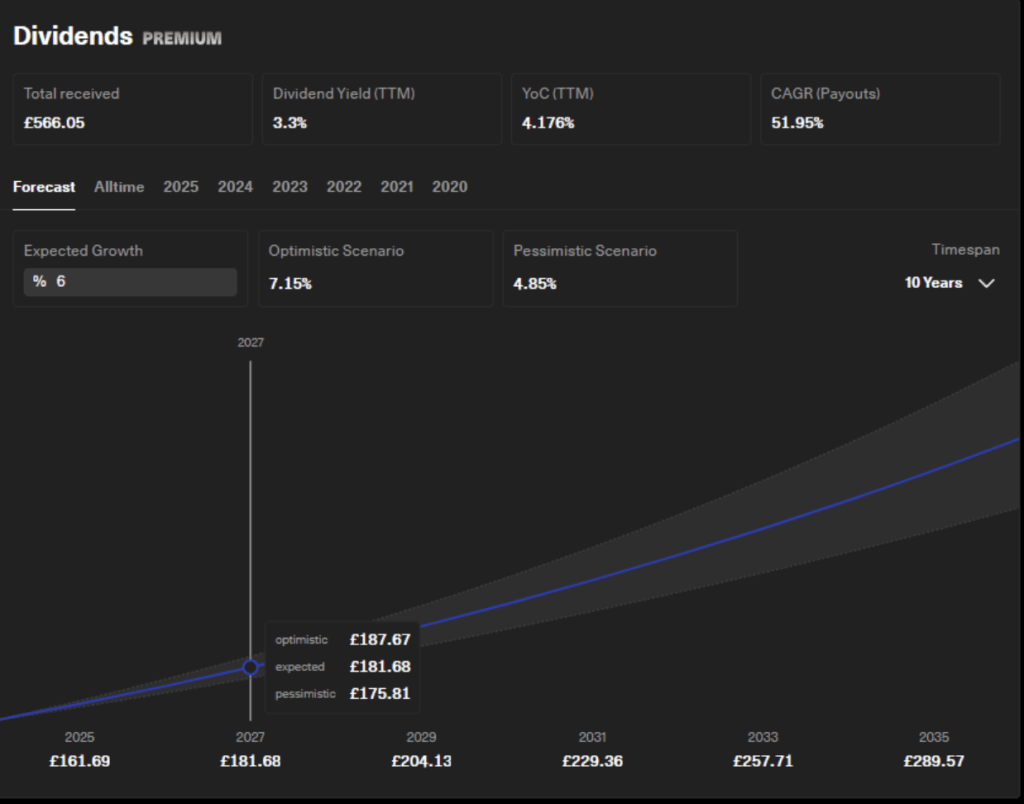
Let’s take a look at the Forecast Feature that GetQuin has.
Under the Forecast Section, the graph shows how much the forecasted dividend earnings you could get in your current portfolio in the next coming years.
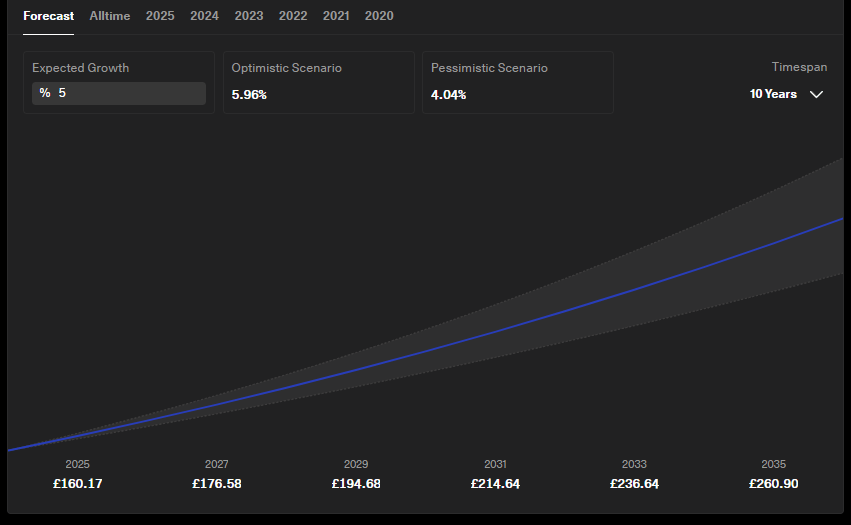
As you can see, for 2025, the projected dividend payments for that year will be £160.17. For 2027, £176.58 of dividend payments.
So technically, in this section, tracking your dividend payments ahead of time is the main purpose of this forecasted dividend earnings. It also shows you the Optimistic Scenario where the dividends may increase, which will be in percentage value and the Pessimistic Scenario where dividends will increase but not at a fast rate compared to optimistic.
If you want to track your dividends by month, you can also do that under the dividends section. Just sect the year you want to track and dividends will be shown every month, also, if it happens that the dividend payment will happened next month, the graph will still show you the forecasted dividend earnings for next month.
Once you have been holding for a long time it will track your historic dividends too like this…
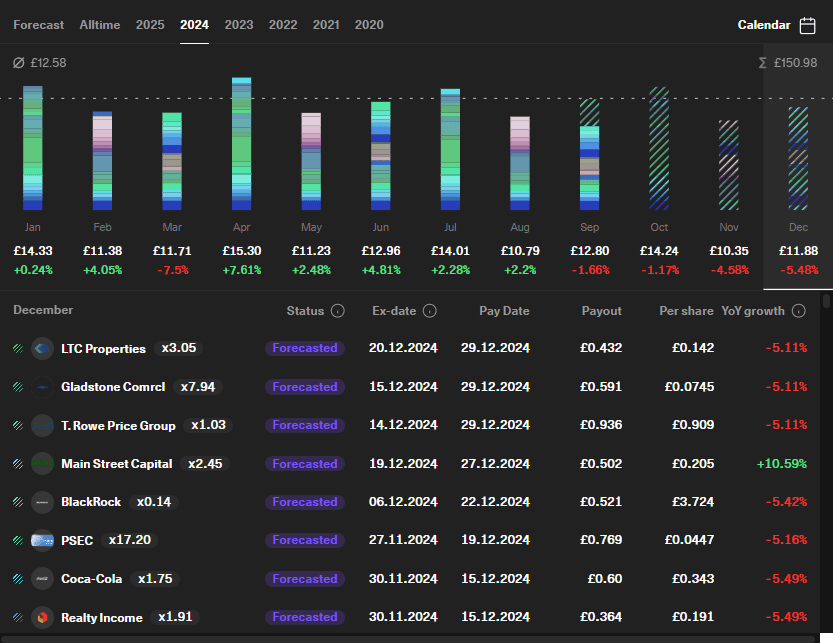
So, below the graph, you will see details of the stocks or companies. Like the Status, Ex-Date, Pay-date, Payout, Per Share, and YoY Growth.
Status simply means the current state of the dividend, either, Announced or Forcasted
Announced Dividends are dividends which are confirmed by the companies.
Forecasted Dividends are based on distributions by the company in the previous year adjusted by today’s currency exchange rate.
Ex-date is the day after which dividend payments will no longer be paid to investors who purchase a share of a security.
Paydate is literally the date where dividend payments should be received
Payout looks at either the total amount distributed or how much of the company’s profits are being given to shareholders.
Per Share focuses on how much money you earn for each share you own.
Year-over-Year Growth describes the payment growth in comparison to the same year prior.
Let’s say you want to see the forecasted dividend payments or earnings for 2025, you may be able to see it in the dividends section.
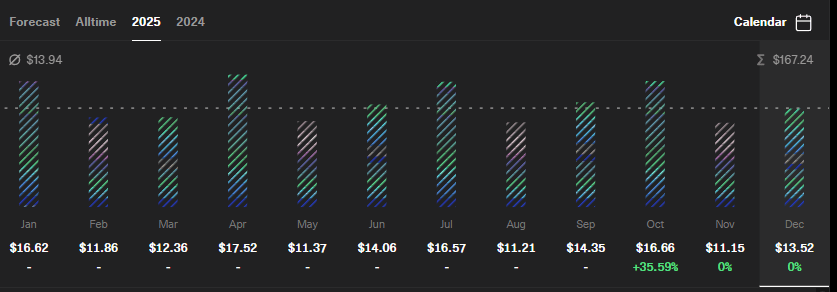
Dividend payments will be shown each month, these values varies from the dividend stocks you currently hold. So if you added another stock or added some share, the 2025 forecasted dividends will be recomputed and will show data.
That’s how you import your Trading 212 portfolio and track your dividends using GetQuin.